In Los Angeles, your risk of losing a limb depends more on where you live than how sick you are.
Fifteen years of evidence. The same devastating pattern — from California discharge data to national Medicare claims to the community-level factors that shape it all.
But there is a counter-narrative: where interdisciplinary teams have been deployed, amputations have been cut in half. This is a solvable problem.
Scroll to begin
Chapter I
The Discovery: A Tenfold Gap
In 2014, Dr. Carl Stevens at Harbor-UCLA noticed something that had been hiding in plain sight: his patients losing limbs to diabetes were overwhelmingly poor. Not just slightly poorer — dramatically, consistently, measurably poorer. He assembled a team to find out if the pattern was real.
Using statewide discharge data for California in 2009, the team identified 7,973 lower-extremity amputations in 6,828 diabetic adults. They mapped every amputation by residential ZIP code and overlaid Census poverty data. What they found was staggering.
10×
Rate variation: poorest vs. wealthiest
Stevens et al., Health Affairs 2014
7,973
Diabetic LEAs in California (2009)
OSHPD Patient Discharge Data
6,828
Unique patients
Adults 45+ with diabetes
Amputation hot spots clustered in lower-income urban and rural regions of California. In LA County, the map told the whole story: South LA, Watts, Compton, and the Gateway Cities glowed red — while Beverly Hills, Santa Monica, and the Westside barely registered. Same county. Same hospitals within driving distance. Radically different outcomes.
Neighborhoods have certain characteristics that allow the households in that neighborhood to produce good health outcomes. When those characteristics are absent, people suffer.
— Dr. Carl Stevens, PBS NewsHour interview, 2014
Chapter II
The National Picture: It's Everywhere
Seven years later, Fanaroff and colleagues asked the next logical question: Is LA an outlier, or is this the American pattern? They analyzed Medicare claims from 2010 to 2018 — nearly 189,000 patients across more than 31,000 ZIP codes nationwide.
188,995
Medicare patients studied
Fanaroff et al., JAHA 2021
31,391
ZIP codes analyzed
2010–2018 CMS claims
78%
Amputees live in metro areas
Not rural — urban
76%
Majority-Black ZIPs in top quartile
For amputation rate
The findings destroyed a comfortable assumption. The medical community had long associated high amputation rates with rural isolation — patients too far from vascular surgeons. But more than three-quarters of amputees lived in metropolitan areas, often within miles of world-class medical centers.
In cities, the gradient was brutally clear: for every $10,000 drop in median household income, amputation rates rose 4.4% — even after controlling for diabetes, hypertension, smoking, and every clinical variable they could measure. And 76% of majority-Black ZIP codes fell into the top quartile for amputations.
The Income Gradient
4.4%
Higher amputation rate per $10,000 decrease in median household income in metro areas, after adjusting for clinical comorbidities and demographics.
The Access Paradox
32%
Of Medicare patients who underwent amputation received zero diagnostic arterial testing in the 12 months before losing their limb. Proximity to care ≠ access to care.
The Geographic Gap
4×
Amputation rates vary up to four-fold across demographic groups and neighborhoods. ZIP codes with lower incomes and fewer healthcare resources are dramatically overrepresented in the highest amputation quartile.
Chapter III
The Structure: Beyond Clinical Care
In 2023, a JAMA Surgery analysis of the 100 most populous US counties asked the deeper question: which community-level factors actually drive amputation rates? They examined 28 individual health and economic metrics across five CDC-defined domains.
The answer wasn't simply "diabetes control." It was the fabric of communities themselves — food access, educational attainment, neighborhood composition, and the density of primary care providers. Counties with high amputation rates had systematically worse scores across every community health metric measured.
Food Access
Counties in the top amputation quartile had significantly higher food insecurity rates. You can't manage diabetes when you can't consistently access healthy food.
Education
Lower educational attainment independently associated with higher amputation rates — reflecting health literacy barriers and the broader environment in which people manage chronic disease.
Primary Care Deserts
Fewer primary care providers per capita meant less chronic disease management, less preventive screening, and more patients presenting with unsalvageable limbs.
Transportation
Georgia DFU data showed public transportation access was protective against amputation in high-income ZIP codes — but not in low-income ones, where transit itself was inadequate.
This is not just about diabetes control — it is about the conditions in which people live, work, and access care.
— Synthesized from JAMA Surgery 2023 community health analysis
Chapter IV
The Geography of Risk: LA County Up Close
The published evidence tells a population-level story. But what does it look like on a map? When you overlay Census poverty data onto LA County ZIP codes and cross-reference with the amputation hot spots identified by Stevens (Health Affairs 2014) and Fanaroff (JAHA 2021), the pattern is unmistakable: the neighborhoods with the highest poverty rates are the same neighborhoods with the highest amputation rates.
10×
Amputation rate gap: poorest vs. wealthiest LA ZIP codes
Stevens et al., Health Affairs 2014
76%
Majority-Black ZIPs in top amputation quartile nationally
Fanaroff et al., JAHA 2021
32%
Of amputees had zero arterial testing beforehand
Fanaroff et al., JAHA 2021
The map below shows LA County ZIP codes shaded by poverty quartile (US Census ACS data). The darkest red zones — South LA, Watts, Compton, Gateway Cities, Wilmington — are the same areas that Stevens identified as amputation hot spots and Fanaroff confirmed at the national level a decade later. Toggle between poverty view and known high-risk zones.
South Central LA (90011, 90003, 90037), Compton (90220, 90221), Watts (90002, 90059), Lynwood (90262), Huntington Park (90255) — these ZIP codes appear in every published analysis as high-amputation, high-poverty, medically underserved zones.
The Cold Spots
Beverly Hills, Santa Monica, Brentwood, Pasadena's western ZIP codes — low poverty, high provider density, robust insurance coverage. Same county, same hospitals within driving distance. Radically different outcomes.
The Divide
The gap isn't about clinical severity or diabetes control. It's about food access, education, provider density, transportation, and insurance — the community conditions that determine who keeps their limbs.
Chapter V
The Human Cost: Worse Than Cancer
Up to one-third of the half billion people with diabetes worldwide will develop a diabetic foot ulcer (DFU) over the course of their lifetime. Over half of those DFUs will become infected, and of those, roughly 20% will require an amputation. Remarkably, people with diabetes fear amputation worse than death. Yet what follows amputation is itself devastating.
In a 2020 pooled analysis, we compared five-year mortality across diabetic foot complications and common cancers. The results reframed the conversation:
Five-year mortality for DFU alone (30.5%) essentially matches the pooled five-year mortality for all reported cancers (31%). Minor amputation mortality (46.2%) exceeds it. And major amputation — at 56.6% — sits between colorectal and lung cancer. DFU and lower extremity amputation are not merely markers of poor health: as shown in the literature, they are independent risk factors associated with premature death. People with a history of DFU have a life expectancy fully 5 years lower than age- and disease-matched controls.
20s
Every 20 seconds: a limb lost to diabetes worldwide
IDF / Boulton, The Lancet 2005
$237B
US direct cost of diabetes (2017)
~$80B attributable to the foot
$80B
US direct cost of all cancer (2015)
Nearly equal to diabetic foot alone
600×
Funding gap: DFU vs. other diabetes research
Armstrong et al., Diabetes Care 2013
Direct costs of diabetes in the US hit $237 billion in 2017. Roughly one-third — approximately $80 billion — is attributable to the lower extremity. That figure is essentially identical to the direct cost of all cancer care in the US ($80.2 billion in 2015). Yet the NCI budget for cancer research is $6.4 billion; federal funding for DFU research remains at a 600-fold disadvantage relative to other diabetes research.
DFU and LEA appear to be more than just a marker of poor health. They are independent risk factors associated with premature death.
If the mortality data reframe the severity of diabetic foot disease, the recurrence data reframe its chronicity. In a 2017 NEJM paper, we proposed that patients with healed DFUs should be considered "in remission" rather than "healed" — because the greatest risk factor for a new DFU is a previously healed one.
In our 2023 JAMA paper, the recurrence data became inescapable: 40% recurrence within 1 year, 65% within 5 years, and greater than 90% within 10 years. In 2025, we went further — comparing three-year recurrence of DFUs and CLTI reintervention directly against advanced-stage cancers:
The three-year DFU recurrence rate of 58% and the CLTI reintervention rate of 50% (from the BEST-CLI trial) are comparable to or exceed the recurrence rates of advanced breast, prostate, and colorectal cancers. Only aggressive lung cancer recurs more frequently.
The Recurrence Trap
65%
Of healed DFUs will recur within 5 years. Greater than 90% within 10 years. The greatest risk factor for a new ulcer is a previously healed one.
CLTI After Endovascular Tx
50%
BEST-CLI trial: 3-year reintervention rate after endovascular therapy for CLTI. Even with surgical bypass, MALE rates reached 42.6%.
The Cancer Comparison
≥
DFU and CLTI recurrence rates meet or exceed those of advanced-stage cancers — yet lack the structured survivorship care plans that oncology takes for granted.
This is why we have argued for a fundamental change in the syntax of diabetic foot care. Patients in "DFU remission" need structured surveillance and proactive management — the same way a cancer survivor works to maximize cancer-free days. The goal: maximize ulcer-free, hospital-free, and activity-rich days.
Healing from a DFU or undergoing successful CLTI intervention should be considered a state of remission, not resolution, necessitating ongoing monitoring.
Stevens and team analyze California OSHPD discharge data. 7,973 diabetic amputations identified. The tenfold variation is documented for the first time at the neighborhood level.
2014
Health Affairs
Stevens et al. publish "Geographic Clustering of Diabetic Lower-Extremity Amputations in Low-Income Regions of California." PBS NewsHour features the story nationally.
Armstrong, Boulton & Bus publish in the New England Journal of Medicine on DFU recurrence, establishing the "remission" framework: 40% recurrence at 1 year, 65% at 5 years, >90% at 10 years. The greatest risk factor for a DFU is a previously healed DFU.
Armstrong et al. update the 5-year mortality comparison: DFU 30.5%, minor amputation 46.2%, major amputation 56.6% — all comparable to or worse than pooled cancer mortality (31%). Direct costs also comparable: ~$80B diabetic foot vs. $80B all cancer.
2021
JAHA Publication
Fanaroff et al. demonstrate that the pattern is driven by community-level factors: income, neighborhood composition, and healthcare access — not clinical factors alone — shape amputation geography. 188,995 Medicare patients across 31,391 ZIP codes.
Armstrong, Tan, Boulton & Bus publish in JAMA on DFUs. Simultaneously, a JAMA Surgery community health analysis of 100 most populous US counties quantifies 28 metrics driving amputation rates.
Bazikian, Khan & Armstrong publish the LA County LPS study: 731 DFU patients, 976 procedures. Interdisciplinary "hot foot line" cuts major amputations by 45.5%, reduces LOS by 15%, increases outpatient procedures 5-fold. OR 0.5 for major amputation. 89% Hispanic population.
Armstrong NS, Armstrong AA, Mills, Conte, Tan, Swanson & Armstrong DG demonstrate that 3-year DFU recurrence (58%) and CLTI reintervention (50%) meet or exceed advanced-stage cancer recurrence. The "remission" framework gains new urgency.
2025–26
Present Day
Updated analyses confirm persistent gaps in outcomes. GLP-1RA access, transportation barriers, and primary care deserts identified as new intervention targets. This narrative: a call for hyperlocal action.
Chapter VII
The Way Forward: Solvable
The evidence is overwhelming. The pattern is consistent across 15 years and multiple study designs. But here is the crucial point: this is not an intractable problem. Structured intervention programs have demonstrated dramatic reductions in amputation rates.
Proof of Concept · South Los Angeles · June 2026
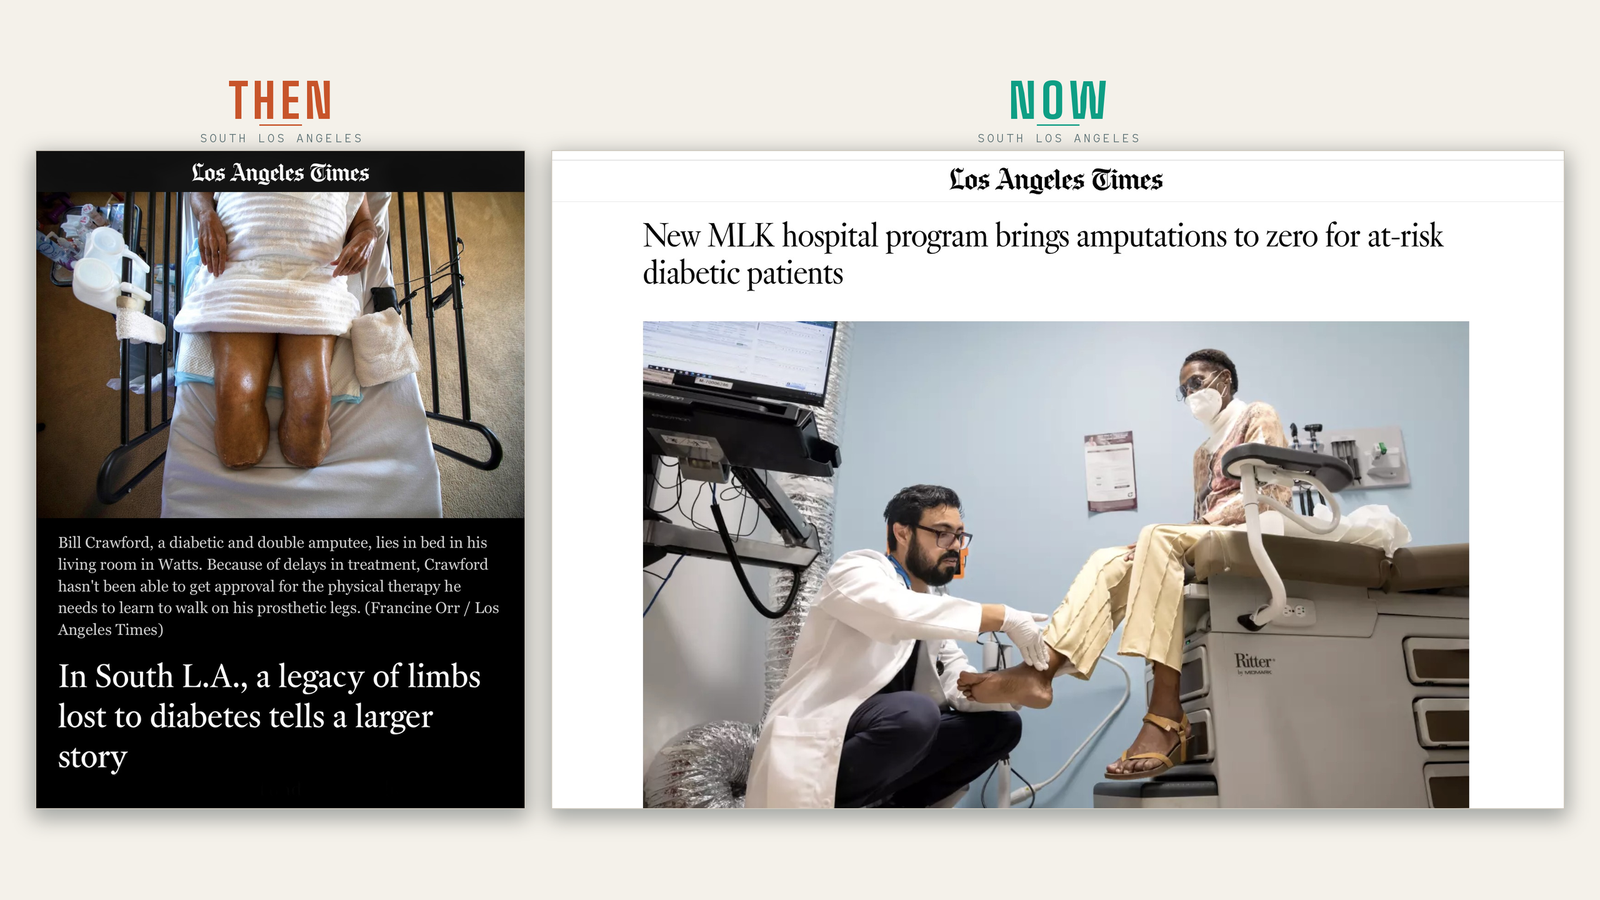
The map said amputations should be worst here. Instead: zero.
Over the fourth year of its Diabetes Management Center of Excellence, MLK Community Healthcare in South LA recorded zero lower-extremity amputations among the highest-risk patients in its intensive-management cohort — in a community with diabetes prevalence roughly 37% higher than LA County overall, where amputation was once among the hospital's most common operations. The four-year intensive-cohort rate was 86 per 100,000 against 390 for the surrounding region (AHRQ PQI-16, 90-day window), across nearly 5,931 enrolled patients. Same ZIP codes. Same map. A registry, a multidisciplinary team, and a model patients can graduate out of.
At a county safety-net hospital in Los Angeles, implementing an interdisciplinary Limb Preservation Service with a single-call "hot foot line" for rapid triage cut major amputations by 45.5% (15.4% → 8.4%, p<0.001). Hospital length of stay dropped from 10.1 to 8.5 days. Outpatient procedures increased over 5-fold. And multivariate analysis confirmed a 50% reduction in the odds of major amputation (OR 0.5, p<0.001) — in a population that is 89% Hispanic.
Centers that combine podiatric ("toe") and vascular ("flow") expertise under one roof consistently report the strongest outcomes. In the published LA County LPS study, the interdisciplinary model integrated vascular interventions in 17.9% of cases — a 6-fold increase from the prior single-specialty service — with revascularization before amputation rather than amputation without workup.
Each $1 invested in care by a podiatrist for people with diabetes results in $27 to $51 of healthcare savings. The LPS model doesn't replace existing services — it supplements them. In the published study, the new interdisciplinary service and the hospital's 40-year single-specialty service coexisted, and both improved.
$27–$51 saved per $1 invested — Gibson et al., Int Wound J, 2013
🚐
Community Screening
Published data show that the vast majority of amputees in LA County live within a tight geographic radius of the hospitals that serve them. Mobile clinics or satellite podiatry offices in South LA or Gateway Cities are high-leverage — intercepting future amputations at the community level before patients present with unsalvageable limbs.
High-risk ZIPs cluster within 15 miles of major medical centers
💊
GLP-1RA Access
Emerging evidence suggests GLP-1 receptor agonists may reduce amputation risk through improved glycemic control, cardiovascular protection, and potential vascular benefits. Ensuring access in high-risk ZIP codes is a new frontier.
Active research area — multiple academic centers
🔍
Arterial Testing
32% of amputees had zero arterial testing beforehand. The LPS model increased vascular consult rates to 33.7% — more than double the pre-LPS rate. Universal screening protocols for at-risk populations in safety-net settings could catch threatened limbs earlier.
Closing the 32% testing gap — Fanaroff et al., JAHA 2021
🤝
Hyperlocal Partnerships
The same 20 ZIP codes appear in every analysis — Stevens, Fanaroff, Census data — as the epicenter of preventable amputations. The success of interdisciplinary models has led LA County to develop what may be the first interdisciplinary county-wide limb preservation working group in the US.
Geographic proximity to subspecialty peripheral artery disease care within metropolitan areas is not adequate to ensure access to high-quality care.
— Fanaroff et al., JAHA 2021
The ZIP code lottery is real, persistent, and documented beyond doubt. But it is also solvable. Every data point in this narrative represents a person. Every amputation that could have been prevented represents a failure of the system, not the patient. The evidence demands hyperlocal, community-based action — and the tools to do it already exist.
Explore the Series
ZIP CodeThe ZIP Code LotteryLA County — published evidence on amputation disparityYou are here
 ↗ Read the full story